How To Make a Twitter Graph with Slash GraphQL
@johnjvesterJohn Vester
Information Technology professional with 25+ years expertise in application design and architecture.
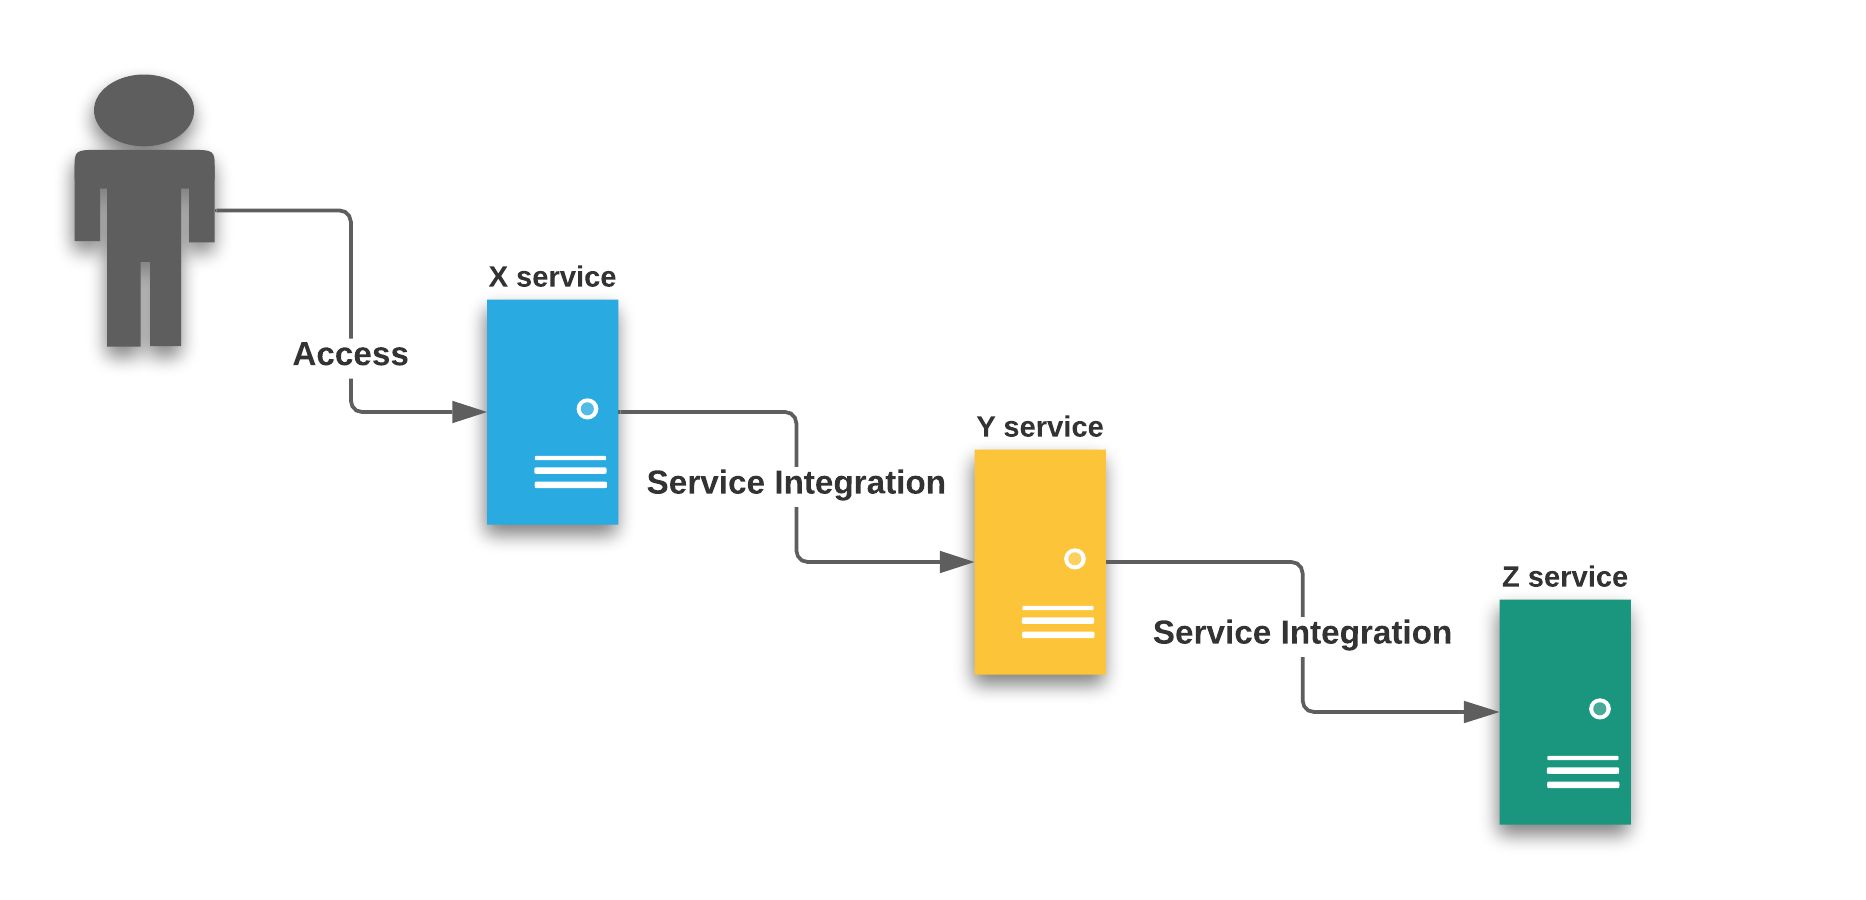
Continuing my personal journey into learning more about Dgraph Slash GraphQL, I wanted to create a graph visualization of data stored in a graph database. Graph visualization (or link analysis) presents data as a network of entities that are classified as nodes and links. To illustrate, consider this very simple network diagram:

While not a perfect example, one can understand the relationships between various services (nodes) and their inner-connectivity (links). This means the X service relies on the Y service to meet the needs of the business. However, what most may not realize is the additional dependency of the Z service, which is easily recognized by this illustration.
For this article, I wanted to build a solution that can dynamically create a graph visualization. Taking this approach, I will be able to simply alter the input source to retrieve an entirely different set of graph data to process and analyze.
The Approach
Instead of mocking up data in a Spring Boot application (as noted in the “Tracking the Worst Sci-Fi Movies With Angular and Slash GraphQL” article), I set a goal to utilize actual data for this article.
From my research, I concluded that the key to a building graph visualization is to have a data set that contains various relationships. Relationships that are not predictable and driven by uncontrolled sources. The first data source that came to mind was Twitter.
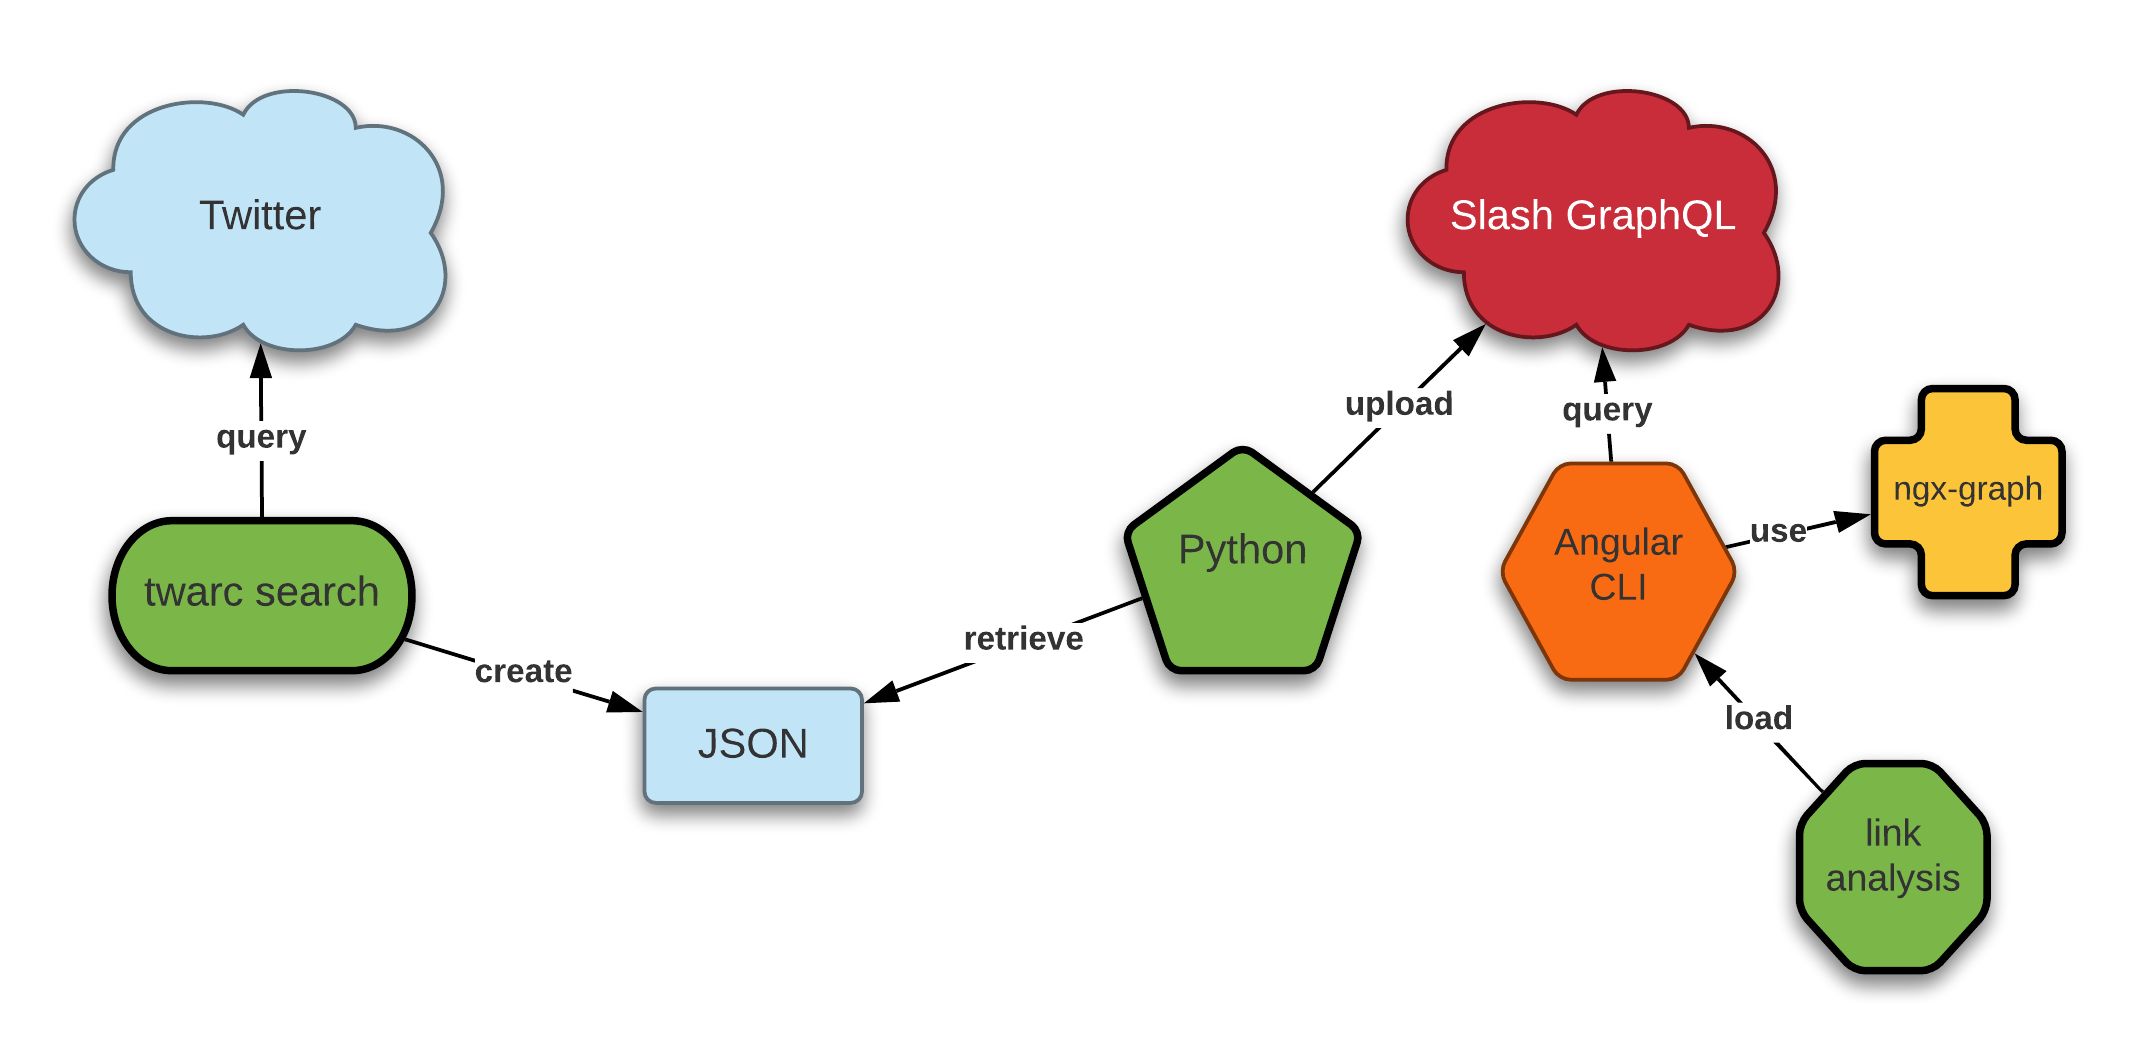
After retrieving data using the Twitter API, the JSON-based data would be loaded into a Dgraph Slash GraphQL database using a somewhat simple Python program and a schema that represents the tweets and users captured by
twarcand uploaded into Slash GraphQL. Using the Angular CLI and the ngx-graph graph visualization library, the resulting data will be graphed to visually represent the nodes and links related to the #NeilPeart hashtag. The illustration below summarizes my approach:

Retrieving Data From Twitter Using `twarc`
While I have maintained a semi-active Twitter account (@johnjvester) for almost nine years, I visited the Twitter Developer Portal to create a project called “Dgraph” and an application called “DgraphIntegration”. This step was necessary in order to make API calls against the Twitter service.

twarcsolution (by DocNow) allows for Twitter data to be retrieved from the Twitter API and returned in an easy-to-use, line-oriented, JSON format. The twarc command line tool was written and designed to work with the Python programming language and is easily configured using the
twarc configurecommand and supplying the following credential values from the “DgraphIntegration” application:
- CONSUMER_KEY
- CONSUMER_SECRET
- ACCESS_TOKEN
- ACCESS_TOKEN_SECRET
With the death of percussionist/lyricist Neil Peart, I performed a search for hashtags that continue to reference this wonderfully-departed soul. The following search command was utilized with twarc:
twarc search #NeilPeart > tweets.jsonlBelow is one example of the thousands of search results that were retrieved via the twarc search:
{
  "content": "It’s been one year since he passed, but the music lives on... he also probably wouldn’t have liked what was going on in the word. Keep resting easy, Neil #NeilPeart https://t.co/pTidwTYsxG",
 "tweet_id": "1347203390560940035",
  "user": {
    "screen_name": "Austin Miller",
    "handle": "AMiller1397"
  }
}
Preparing Dgraph Slash GraphQL
Starting in September 2020, Dgraph has offered a fully managed backend service, called Slash GraphQL. Along with a hosted graph database instance, there is also a RESTful interface. This functionality, combined with 10,000 free credits for API use, provides the perfect target data store for the #NeilPeart data that I wish to graph.
The first step was to create a new backend instance, which I called
tweet-graph:

Next, I created a simple schema for the data I wanted to graph:
type User {
  handle: String! @id @search(by: [hash])
  screen_name: String! @search(by: [fulltext])
}

type Tweet {
  tweet_id: String! @id @search(by: [hash])
  content: String!
  user: User
}

type Configuration {
  id: ID
  search_string: String!
}
The
Userand
Tweettypes house all of the data displayed in the JSON example above. The
Configurationtype will be used by the Angular client to display the search string utilized for the graph data.
Loading Data into Slash GraphQL Using Python
Two Python programs will be utilized to process the JSON data extracted from Twitter using twarc:
- convert – processes the JSON data to identify any Twitter mentions to another user
- upload – prepares and performs the upload of JSON data into Slash GraphQL
The core logic for this example lives in the upload program, which executes the following base code:
data = {}
users = {}

gather_tweets_by_user()

search_string = os.getenv('TWARC_SEARCH_STRING')
print(search_string)

upload_to_slash(create_configuration_query(search_string))

for handle in data:
    print("=====")
    upload_to_slash(create_add_tweets_query(users[handle], data[handle]))
- The
gather_tweets_by_user()organizes the Twitter data into the
dataand
usersobjects.
- The
upload_to_slash(create_configuration_query(search_string))stores the search that was performed into Slash GraphQL for use by the Angular client
- The
forloop processes the
dataand
userobjects, uploading each record into Slash GraphQL using
upload_to_slash(create_add_tweets_query(users[handle], data[handle]))
Once the program finishes, you can execute the following query from the API Explorer in Slash GraphQL:
query MyQuery {
  queryTweet {
    content
    tweet_id
    user {
      screen_name
      handle
    }
  }
}

query MyQuery {
  queryConfiguration {
    search_string
  }
}
Using `ngx-graph` With Angular CLI
The Angular CLI was used to create a simple Angular application. In fact, the base component will be expanded for use by
ngx-graph, which was installed using the following command:
npm install @swimlane/ngx-graph --saveHere is the working AppModule for the application:
@NgModule({
  declarations: [
    AppComponent
  ],
  imports: [
    BrowserModule,
    BrowserAnimationsModule,
    AppRoutingModule,
    HttpClientModule,
    NgxGraphModule,
    NgxChartsModule,
    NgxSpinnerModule
  ],
  schemas: [CUSTOM_ELEMENTS_SCHEMA],
  providers: [],
  bootstrap: [AppComponent]
})
export class AppModule { }
In order to access data from Slash GraphQL, the following method was added to the GraphQlService in Angular:
allTweets:string = 'query MyQuery {' +
  '  queryTweet {' +
  '    content' +
  '    tweet_id' +
  '    user {' +
  '      screen_name' +
  '      handle' +
  '    }' +
  '  }' +
  '}';

getTweetData() {
  return this.http.get<QueryResult>(this.baseUrl + '?query=' + this.allTweets).pipe(
    tap(),
    catchError(err => { return ErrorUtils.errorHandler(err)
    }));
}
Preparing Slash GraphQL to Work With `ngx-graph`
The data in Slash GraphQL must be modified in order to work with the
ngx-graphframework. As a result, a ConversionService was added to the Angular client, which performed the following tasks:
createGraphPayload(queryResult: QueryResult): GraphPayload {
  let graphPayload: GraphPayload = new GraphPayload();

  if (queryResult) {
    if (queryResult.data && queryResult.data.queryTweet) {
      let tweetList: QueryTweet[] = queryResult.data.queryTweet;

      tweetList.forEach( (queryTweet) => {
        let tweetNode:GraphNode = this.getTweetNode(queryTweet, graphPayload);
        let userNode:GraphNode = this.getUserNode(queryTweet, graphPayload);

        if (tweetNode && userNode) {
          let graphEdge:GraphEdge = new GraphEdge();
          graphEdge.id = ConversionService.createRandomId();

          if (tweetNode.label.substring(0, 2) === 'RT') {
            graphEdge.label = 'retweet';
          } else {
            graphEdge.label = 'tweet';
          }

          graphEdge.source = userNode.id;
          graphEdge.target = tweetNode.id;
          graphPayload.links.push(graphEdge);
        }
      });
    }
  }

  console.log('graphPayload', graphPayload);
  return graphPayload;
}
The resulting structure contains the following object hierarchy:
export class GraphPayload {
  links: GraphEdge[] = [];
  nodes: GraphNode[] = [];
}

export class GraphEdge implements Edge {
  id: string;
  label: string;
  source: string;
  target: string;
}

export class GraphNode implements Node {
  id: string;
  label: string;
  twitter_uri: string;
}
While this work could have been completed as part of the load into Slash GraphQL, I wanted to keep the original source data in a format that could be used by other processes and not be proprietary to
ngx-graph.
Configuring the Angular View
When the Angular client starts, the following
OnInitmethod will fire, which will show a spinner while the data is processing. Then, it will display the graphical representation of the data once Slash GraphQL has provided the data and the ConversionService has finished processing the data:
ngOnInit() {
  this.spinner.show();

  this.graphQlService.getConfigurationData().subscribe(configs => {
    if (configs) {
      this.filterValue = configs.data.queryConfiguration[0].search_string;

      this.graphQlService.getTweetData().subscribe(data => {
        if (data) {
          let queryResult: QueryResult = data;
          this.graphPayload = this.conversionService.createGraphPayload(queryResult);
          this.fitGraph();
          this.showData = true;
        }
      }, (error) => {
        console.error('error', error);
      }).add(() => {
        this.spinner.hide();
      });
    }
  }, (error) => {
    console.error('error', error);
  }).add(() => {
    this.spinner.hide();
  });
}
On the template side, the following
ngxtags were employed:
<ngx-graph *ngIf="showData"
  class="chart-container"
  layout="dagre"
  [view]="[1720, 768]"
  [showMiniMap]="false"
  [zoomToFit$]="zoomToFit$"
  [links]="graphPayload.links"
  [nodes]="graphPayload.nodes"
>
  <ng-template #defsTemplate>
    <svg:marker id="arrow" viewBox="0 -5 10 10" refX="8" refY="0" markerWidth="4" markerHeight="4" orient="auto">
      <svg:path d="M0,-5L10,0L0,5" class="arrow-head" />
    </svg:marker>
  </ng-template>

  <ng-template #nodeTemplate let-node>
    <svg:g class="node" (click)="clickNode(node)">
      <svg:rect
        [attr.width]="node.dimension.width"
        [attr.height]="node.dimension.height"
        [attr.fill]="node.data.color"
      />
      <svg:text alignment-baseline="central" [attr.x]="10" [attr.y]="node.dimension.height / 2">
        {{node.label}}
      </svg:text>
    </svg:g>
  </ng-template>

  <ng-template #linkTemplate let-link>
    <svg:g class="edge">
      <svg:path class="line" stroke-width="2" marker-end="url(#arrow)"></svg:path>
      <svg:text class="edge-label" text-anchor="middle">
        <textPath
          class="text-path"
          [attr.href]="'#' + link.id"
          [style.dominant-baseline]="link.dominantBaseline"
          startOffset="50%"
        >
          {{link.label}}
        </textPath>
      </svg:text>
    </svg:g>
  </ng-template>

</ngx-graph>
The
ng-templatetags not only provide a richer presentation of the data but also introduce the ability to click on a given node and see the original tweet in a new browser window.
Running the Angular Client
With the Angular client running, you can retrieve the data from the Slash GraphQL by navigating to the application. You will then see a user experience similar to below:

It is possible to zoom into this view and even rearrange the nodes to better comprehend the result set.

Please note: For those who are not fond of the “dagre” layout, you can adjust the
ngx-graph.layoutproperty to another graph layout option in
ngx-graph.
When the end-user clicks a given node, the original message in Twitter displays in a new browser window:

Conclusion
A fully-functional Twitter Graph was created using the following frameworks and services:
- Twitter API and Developer Application
- twarc and custom Python code
- Dgraph Slash GraphQL
- Angular CLI and
ngx-graph
In a matter of steps, you can analyze Twitter search results graphically, which will likely expose links and nodes that are not apparent through any other data analysis efforts. This is similar to the network example in the introduction of this article that exposed a dependency on the Z service.
If you are interested in the full source code for the Angular application, including the Python import programs referenced above, please visit the following repository on GitLab:
https://gitlab.com/johnjvester/tweet-graph-client
Have a really great day!
Also published at https://dzone.com/articles/creating-a-twitter-graph-using-slash-graphql
Tags
Create your free account to unlock your custom reading experience.


